New year, new interactive projection art. I'm in the process of creating a new installation piece, this time centered on the night sky. This is sort of a build log where I describe how I fumbled through the dark toward something resembling art.
As usual, this is an openFrameworks application that uses OpenNI2 and NiTE2 to use the viewers' bodies as input data. I should move from NiTE2 to a non-proprietary computer vision library, but I'm lazy.
The code for this project can be found at github.com/TooManyBees/shes-full-of-stars.
First, some motivation
From the start, I wanted a new interactive projection installation.
Specifically, I wanted a program that would draw its users as constellations on a night sky.
More specifically, I wanted to run this program on a friend's projector, then virtually turn our bodies into constellations as we turn to each other and kiss in the dim glow of ourselves-as-stars.
And, like, getting super in depth about about my specific goal, I really wanted to give my brain a creative outlet in order to externalize all of those romantic feelings and distract myself from falling in love with them before I'm ready to handle that shit.
Honestly, that's been the most successful aspect of this project so far. 🙃
Now, some initial project milestones
- Draw stars on the screen
- Add user detection
- Find a way to detect which stars fall inside a user's shadow
- Generate a fictional constellation out of the stars inside a user's shadow
- Don't fall in love with my friend (yet)
Finding input data
I have nothing against fictional alien skies, but I didn't trust any random placement algorithm to look as good as the night sky I already know and love. I went out in search of star catalogues, which (after a brief detour around Star Trek Fandom Internet which apparently controls the SEO to the phrase "stellar cartography") landed me in Astronomy Internet.
I found myself reading Project Rho's 3-D Starmaps directory where I learned about the HYG Database, a synthesis of the Hipparcos Catalog, the Yale Bright Star Catalogue, and the Gliese Catalog of Nearby Stars.
Now, openFrameworks is a C++ library, so naturally my first step is to preprocess all my input data in a Rust script because of course I would. (Actually it's because Serde is out-of-this-world great.) In all seriousness, I do need to preprocess the dataset: it comes with 120,000 stars, and I only care about the ones we can see with the naked eye. The preprocessing script brings the dataset down to 15,000 stars, each record trimmed to just coordinates, name (if any), magnitude, and color index.
Rendering a celestial sphere
My first goal was to draw all my points in a celestial sphere, capture the viewer's physical profile with OpenNI2, then determine which stars in 2-dimensional screen space fall within the viewer's 2-dimensional silhouette.
Putting the celestial sphere on the screen was easy: make a new mesh, create a new glm::vec3 point for each star's cartesian coordinates, convert them to points on an abstract celestial sphere, then push them to the mesh's vertices.
ofMesh stars;
double radius = 1000.0;
glm::vec3 origin(0, 0, 0);
glm::vec3 pos, normal; // normal goes unused
ofJson parsedJsonStars = ofLoadJson("hyg.json");
for (auto star : parsedJsonStars) {
    glm::vec3 xyz(star["x"], star["y"], star["z"]);
    // Find each star's place on a sphere of radius 1000
    bool b = glm::intersectLineSphere(origin, xyz, origin, radius, pos, normal);
    if (b) {
        stars.addVertex(pos);
    }
}
stars.setMode(OF_PRIMITIVE_POINTS);
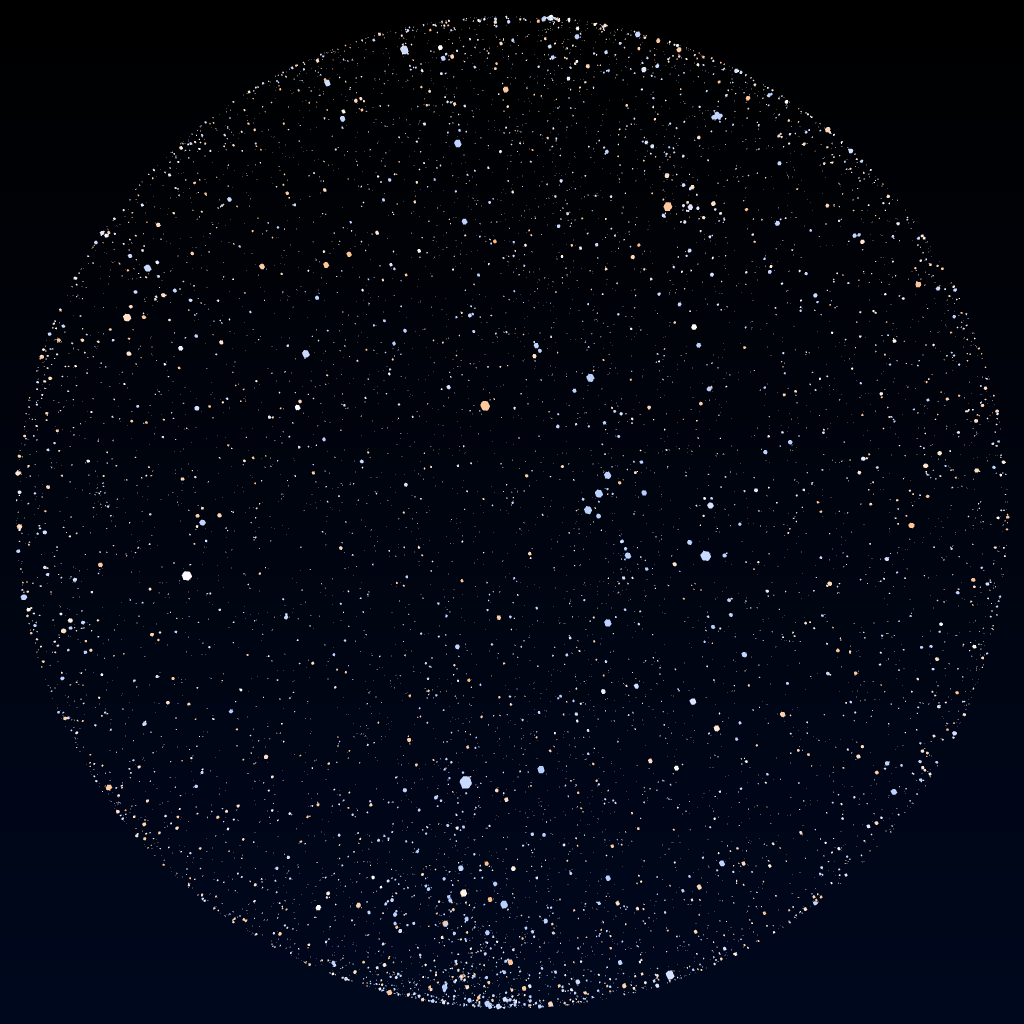
The result:
Any variation in brightness is due to antialiasing since the points are not perfectly aligned with the screen pixels.
Detecting stars covered by the viewer's silhouette
The next step is to detect the viewer with OpenNI and NiTE (simple, I've done this plenty of times) and then detect which stars fall beneath their silhouette.
The code to do this in openFrameworks is also pretty simple. camera is our point of view at the center of the celestial sphere, and each star is a glm::vec3 of XYZ coordinates. nite::UserMap is a glorified bitmap in which nonzero values indicate a person detected there. (It actually also tells us which person is there, but I didn't care about that.)
bool isStarInProfile(ofCamera &camera, glm::vec3 &star, nite::UserMap &map) {
    glm::vec3 screenCoordinates = camera.worldToScreen(star);
    int x = screenCoordinates.x / ofGetWidth() * map.getWidth();
    int y = screenCoordinates.y / ofGetHeight() * map.getHeight();
    if (x < 0 || y < 0 || x >= map.getWidth() || y >= map.getHeight())
        return false;
    nite::UserId* users = map.getPixels();
    return users[y * map.getWidth() + x] > 0;
}
So for each star, we can convert its world coordinates to screen coordinates, map those to the user map dimensions (which never change once the app is initialized; I always run the sensor at 640 by 480), then get the corresponding pixel to see if a user is present.
Let's face it, I'm Bad At OpenGL
My next step was to size the stars according to their magnitude. Star magnitude is a semi-arbitrary measurement of brightness.
The original concept dates back to the 2nd century B.C.E. The brightest stars were given a magnitude class of 1 and the faintest visible stars were given magnitudes of 6.
The modern measurement maps the ancient concept to a logarithmic scale, such that each decrease of 1 magnitude accounts for a 2.512-fold increase in apparent brightness. (That's the 5th root of 100, by the way.) This also allows for stars to be assigned fractional values in between whole magnitudes. The reference by which all other stars are measured (since magnitude is a unitless value) is Vega: it has a magnitude of 0.
That precise math would come in handy later, but when I just wanted to get it rendering I simplified the math down to this linear curve:
// The faintest stars I kept in the dataset were magnitude 6.99
float apparentSize = (-1.0 * magnitude) + 7.0;
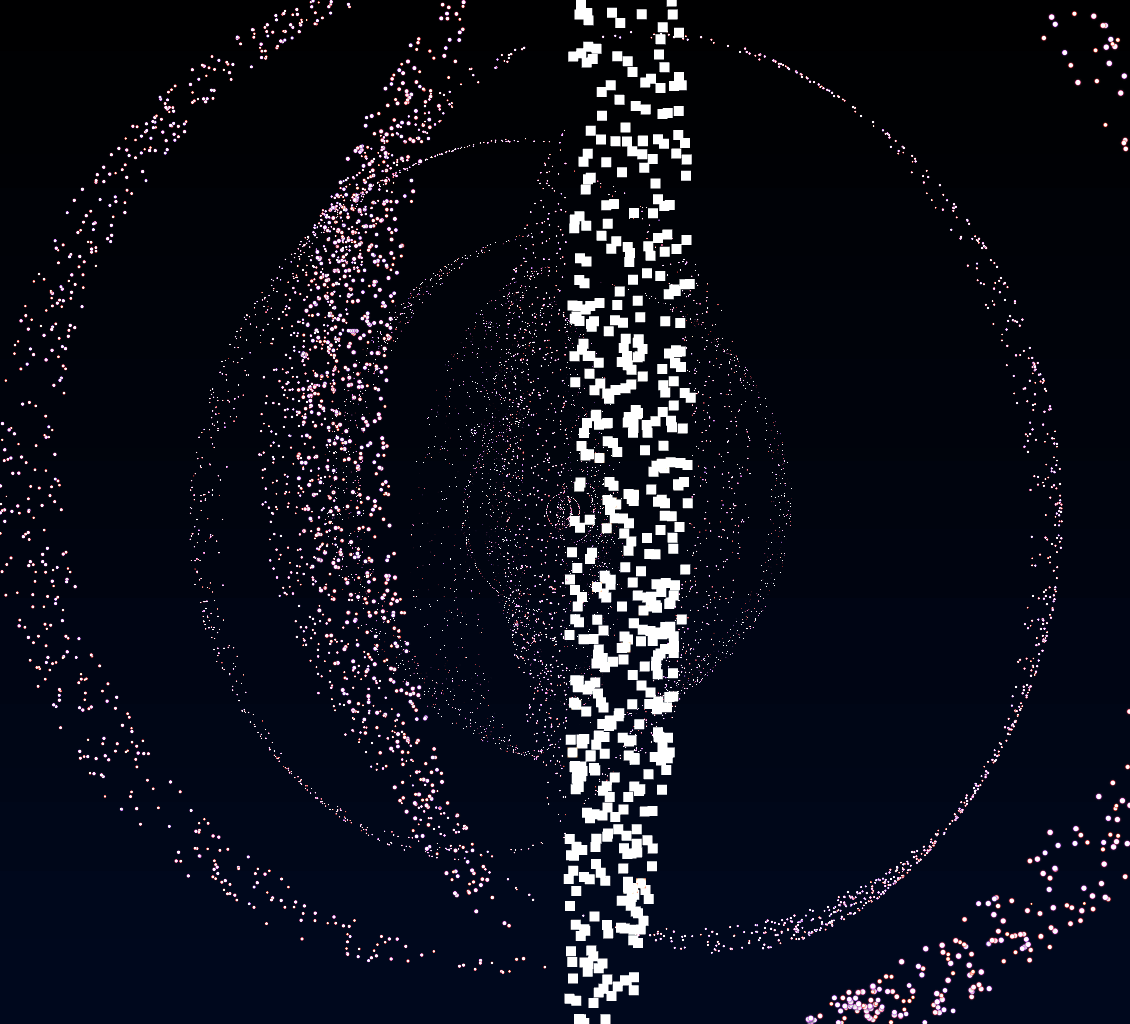
The stars were rendering correctly. For the very first time, I swapped my camera out for an ofEasyCam which adds mouse controls for free, so I could look at my celestial sphere from afar, but something was amiss. That's no sphere!
All the stars were distributed in a messy field, not a crisp sphere like I thought they were when I looked out from inside. Turns out my matrix math sucks, though I wouldn't figure that out for a while.
Yeah I'm a BAD GIRL
Bad
At
Doing even mildly complex math in Open
G
I
R
L
I'd have to fix that eventually, but I had bigger fish to fry, and also I wanted to an excuse to use that phrase in a blog post some day. I needed to make sense of how stars are colored, how color index relates to color temperature, and how that translates to RGB colors. I started browsing Wikipedia and Shadertoy for examples of black-body radiation equations.
I spent time reading up on Betelgeuse, one of the brightest stars in the sky, and notable to me because it's visibly reddish. Betelgeuse is on the shoulder of the Orion constellation, the most recognizable from my childhood; one of the only I could recognize, for that matter, along with the Big and Little Dippers.
I immersed myself in constellation lore, because researching minutiae is apparently just how I recharge my brain when I'm exhausted.
Did ya know that Ursa Major is more than just the Big Dipper? Yeah, there's a lot more bear to go around, the Big Dipper is just its tail and hindquarters.
Did ya know that Aquarius depicts Enki, the Sumerian god of water who created humankind? I still think it just looks like a squiggle, but at least my sun sign has a cool namesake. ♒️
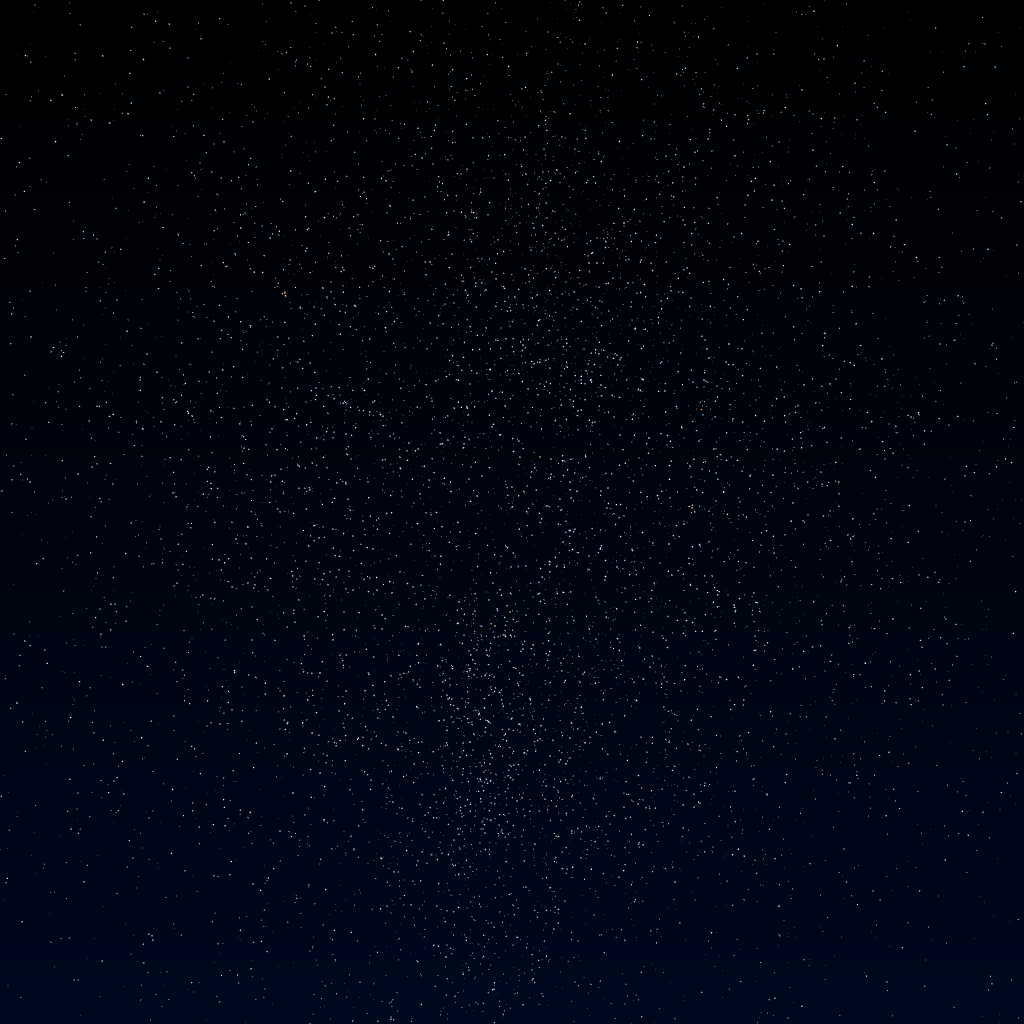
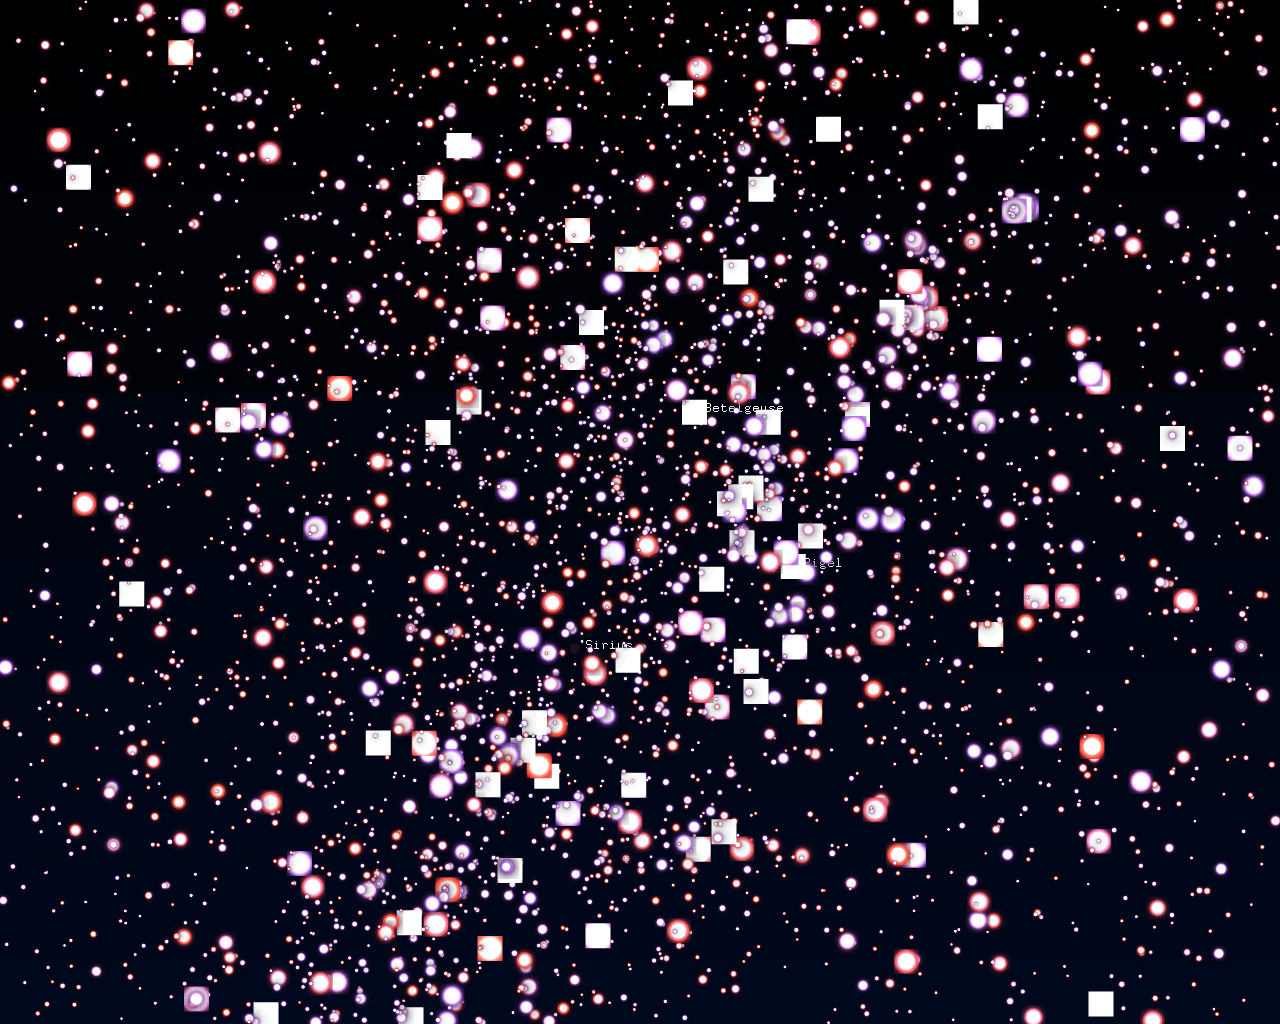
I just mention all that to emphasise what was foremost in my mind when I finally corrected the vector addition in my vertex shader, live-reloaded, and as the stars suddenly snapped into a spherical shell, suddenly exclaimed, "Holy shit! That's Betelgeuse!"
Can you see it? It's the big orange dot, near the center of the image. Try mousing over it. Diagonally down and to the right would be Orion's belt (the only part of the constellation I could pick out as a kid), and almost straight down is Sirius, a big blue dot, the brightest star in the sky.
This was easily the most satisfying moment in my project. My research and code came together in a way that reminded me I'm not completely in the dark. I have an intuition about what I'm doing!
Getting the math right: color temp, magnitude, and point spread functions
The above screenshot shows a celestial sphere with accurate star placement, but the stars' colors and sizes are simplistic. In reality, I didn't want my stars to be multicolored orbs that scale linearly according to their magnitude, I wanted their magnitude to affect their brightness, which in turn would give them their apparent size. Just like stars we observe with our eyes. (And magnitude classification was originally developed to measure apparent size, after all.)
This fragment shader from Shadertoy offered an equation for turning color temperature into RGB values, which I happily transposed to C++ without really understanding it. 🤪
float intPlanck(float t, float lambda1, float lambda0) {
  // Intermediate helper function snipped
}

ofFloatColor colorIndexToRGB(float bv) {
  float colorTemp = 4600.0 / (0.92 * bv + 1.7) + 4600.0 / (0.92 * bv + 0.62);
  glm::vec3 rgb = glm::vec3(
    intPlanck(colorTemp, 0.7e-6, 0.55e-6),
    intPlanck(colorTemp, 0.55e-6, 0.49e-6),
    intPlanck(colorTemp, 0.49e-6, 0.4e-6)
  ) * 1e-14;
  return ofFloatColor(rgb.x, rgb.y, rgb.z);
}
An ofFloatColor is a 4-D vector whose components range from 0.0 (black, transparent) to 1.0 (white, opaque). An interesting thing, though, is that colorIndexToRGB returns colors with RGB components well above 1.0, which would clip the color at pure white. It turns out that this is will help give stars their distinctive appearance as pinpricks of light that quickly fade with a dim halo around them.
The point spread function (PSF) describes how stars have an apparent size relative to their magnitude. This graph of apparent size and brightness helps to visualize what I described above with regard colors that extend beyond the 0.0-1.0 range. The asymptote would cause brightness clipping at the center of the star before dimming farther out.
We can multiply the color of a star by some intensity value I, then give it a brightness falloff over distance D from its center. At some distance the color will dip below 1.0, and it will begin fading into the background of the scene. This is what gives the stars their apparent sizes: the brighter the magnitude, the farther from the center of the star that it starts to decrease in brightness. Here's what it looks like in the fragment shader:
vec4 starPSF(vec4 color, float magnitude) {
    float invertedMagnitude = -1 * magnitude + 7;
    float I = pow(10, 0.2 * invertedMagnitude);
    float D = distance(vec2(0.5), gl_PointCoord.st) * 45;
    return color * I / (D * D * D);
}
color and magnitude are varying attributes per point. Since this is running on each point, vec2(0.5) is the center of each star, so distance from it (modified by an arbitrary multiplier) gives the PSF its brightness falloff.
Getting the math right is hard, though. Here are some more cases where I accidentally blew up the universe I was tinkering with:
The bug that made all the stars appear in a cloud rather than a sphere was due to accidentally modifying a vector's W component. This is caused by that too! I made the same math mistake twice!
I got the math right
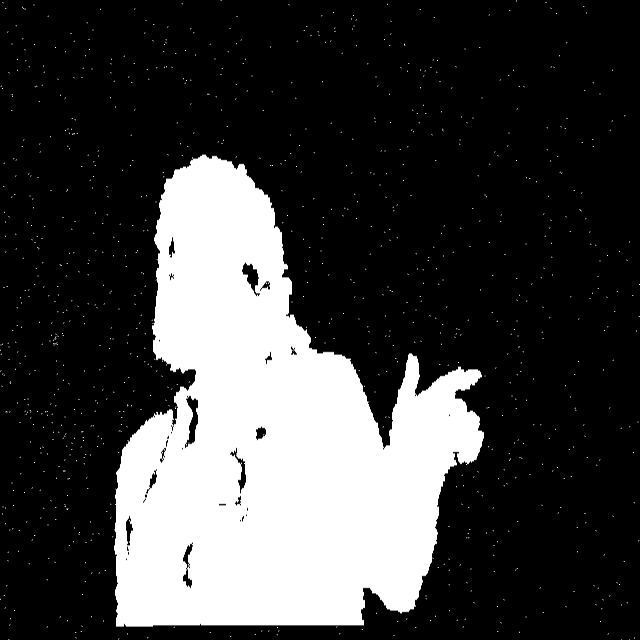
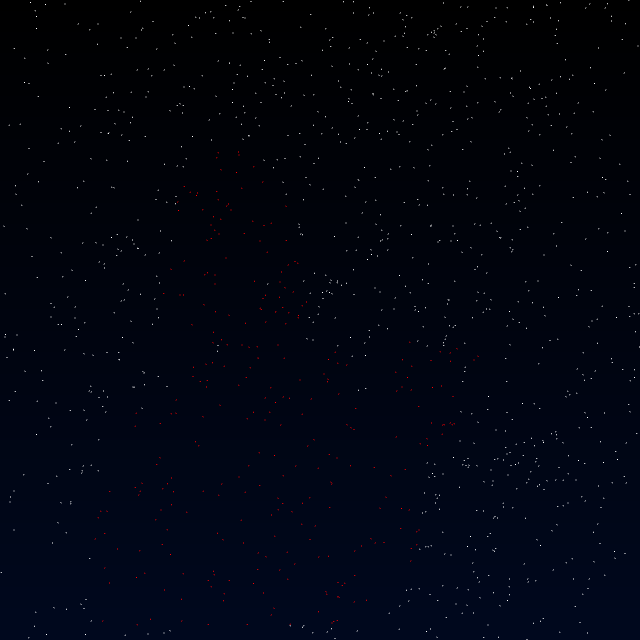
Anyways, remember the first thing I implemented in this interactive: determining which stars were inside of my silhouette?
Rather than painting the stars red, I boosted their magnitude. Interestingly, the goal of the interactive was never to "cast my shadow" in stars, but the entrancing starry silhouette was an unexpected free effect.
This is a good resting point to survey my progress and decide where to go next.